In Colombia, the restaurant industry represents 3.9% of the gross domestic product in the country. Treinta aims to help restaurants thrive with digital tools that improve their day-to-day operations.
In Colombia, the restaurant industry represents 3.9% of the gross domestic product in the country. Treinta aims to help restaurants thrive with digital tools that improve their day-to-day operations.
In Colombia, the restaurant industry represents 3.9% of the gross domestic product in the country. Treinta aims to help restaurants thrive with digital tools that improve their day-to-day operations.
Client
Treinta
Services
Ux research
User experience
User interface
Prototyping
Industries
Saas
Date
Jul 2023 - Nov 2024
Problem statement
Problem statement
Month by month we lost more than 60% of paid users because our product did not solve all the needs they had.
Month by month we lost more than 60% of paid users because our product did not solve all the needs they had.
Month by month we lost more than 60% of paid users because our product did not solve all the needs they had.
🥺 Low management efficiency
🥺 Low management efficiency
🥺 Low management efficiency
Owners didn't have enough tools to take decisions and improve the operation.
😫 Complex order creation
😫 Complex order creation
😫 Complex order creation
The system didn’t help waiters to solve everyday situations.
😳 Software isn't enough
😳 Software isn't enough
😳 Software isn't enough
Hardware was a must, and we had to make it works easy with the software.
Design process
Talk with churn users Quantity info our database users Tickets of customer support Interviews and polls
Talk with churn users Quantity info our database users Tickets of customer support Interviews and polls
Talk with churn users Quantity info our database users Tickets of customer support Interviews and polls
Document insights Prioritize user needs Benchmark
Document insights Prioritize user needs Benchmark
Document insights Prioritize user needs Benchmark
Brainstorming with team Prioritize ideas based on impact vs effort
Build a real representation of the ideas Usability testing with users
Restaurants are complex businesses, we have to benefit the entire ecosystem, but to solve this business problem, we start with two principal users:
Andrés Torres
Andrés Torres
Restaurants etrepeneur
35 years old.
College degree
Bogotá - Colombia
🎯 Goal
🎯 Goal
Open more restaurants in the city with a delightful experience.
😫 Frustrations:
😫 Frustrations:
Most of the time, his restaurants works better when he is there.
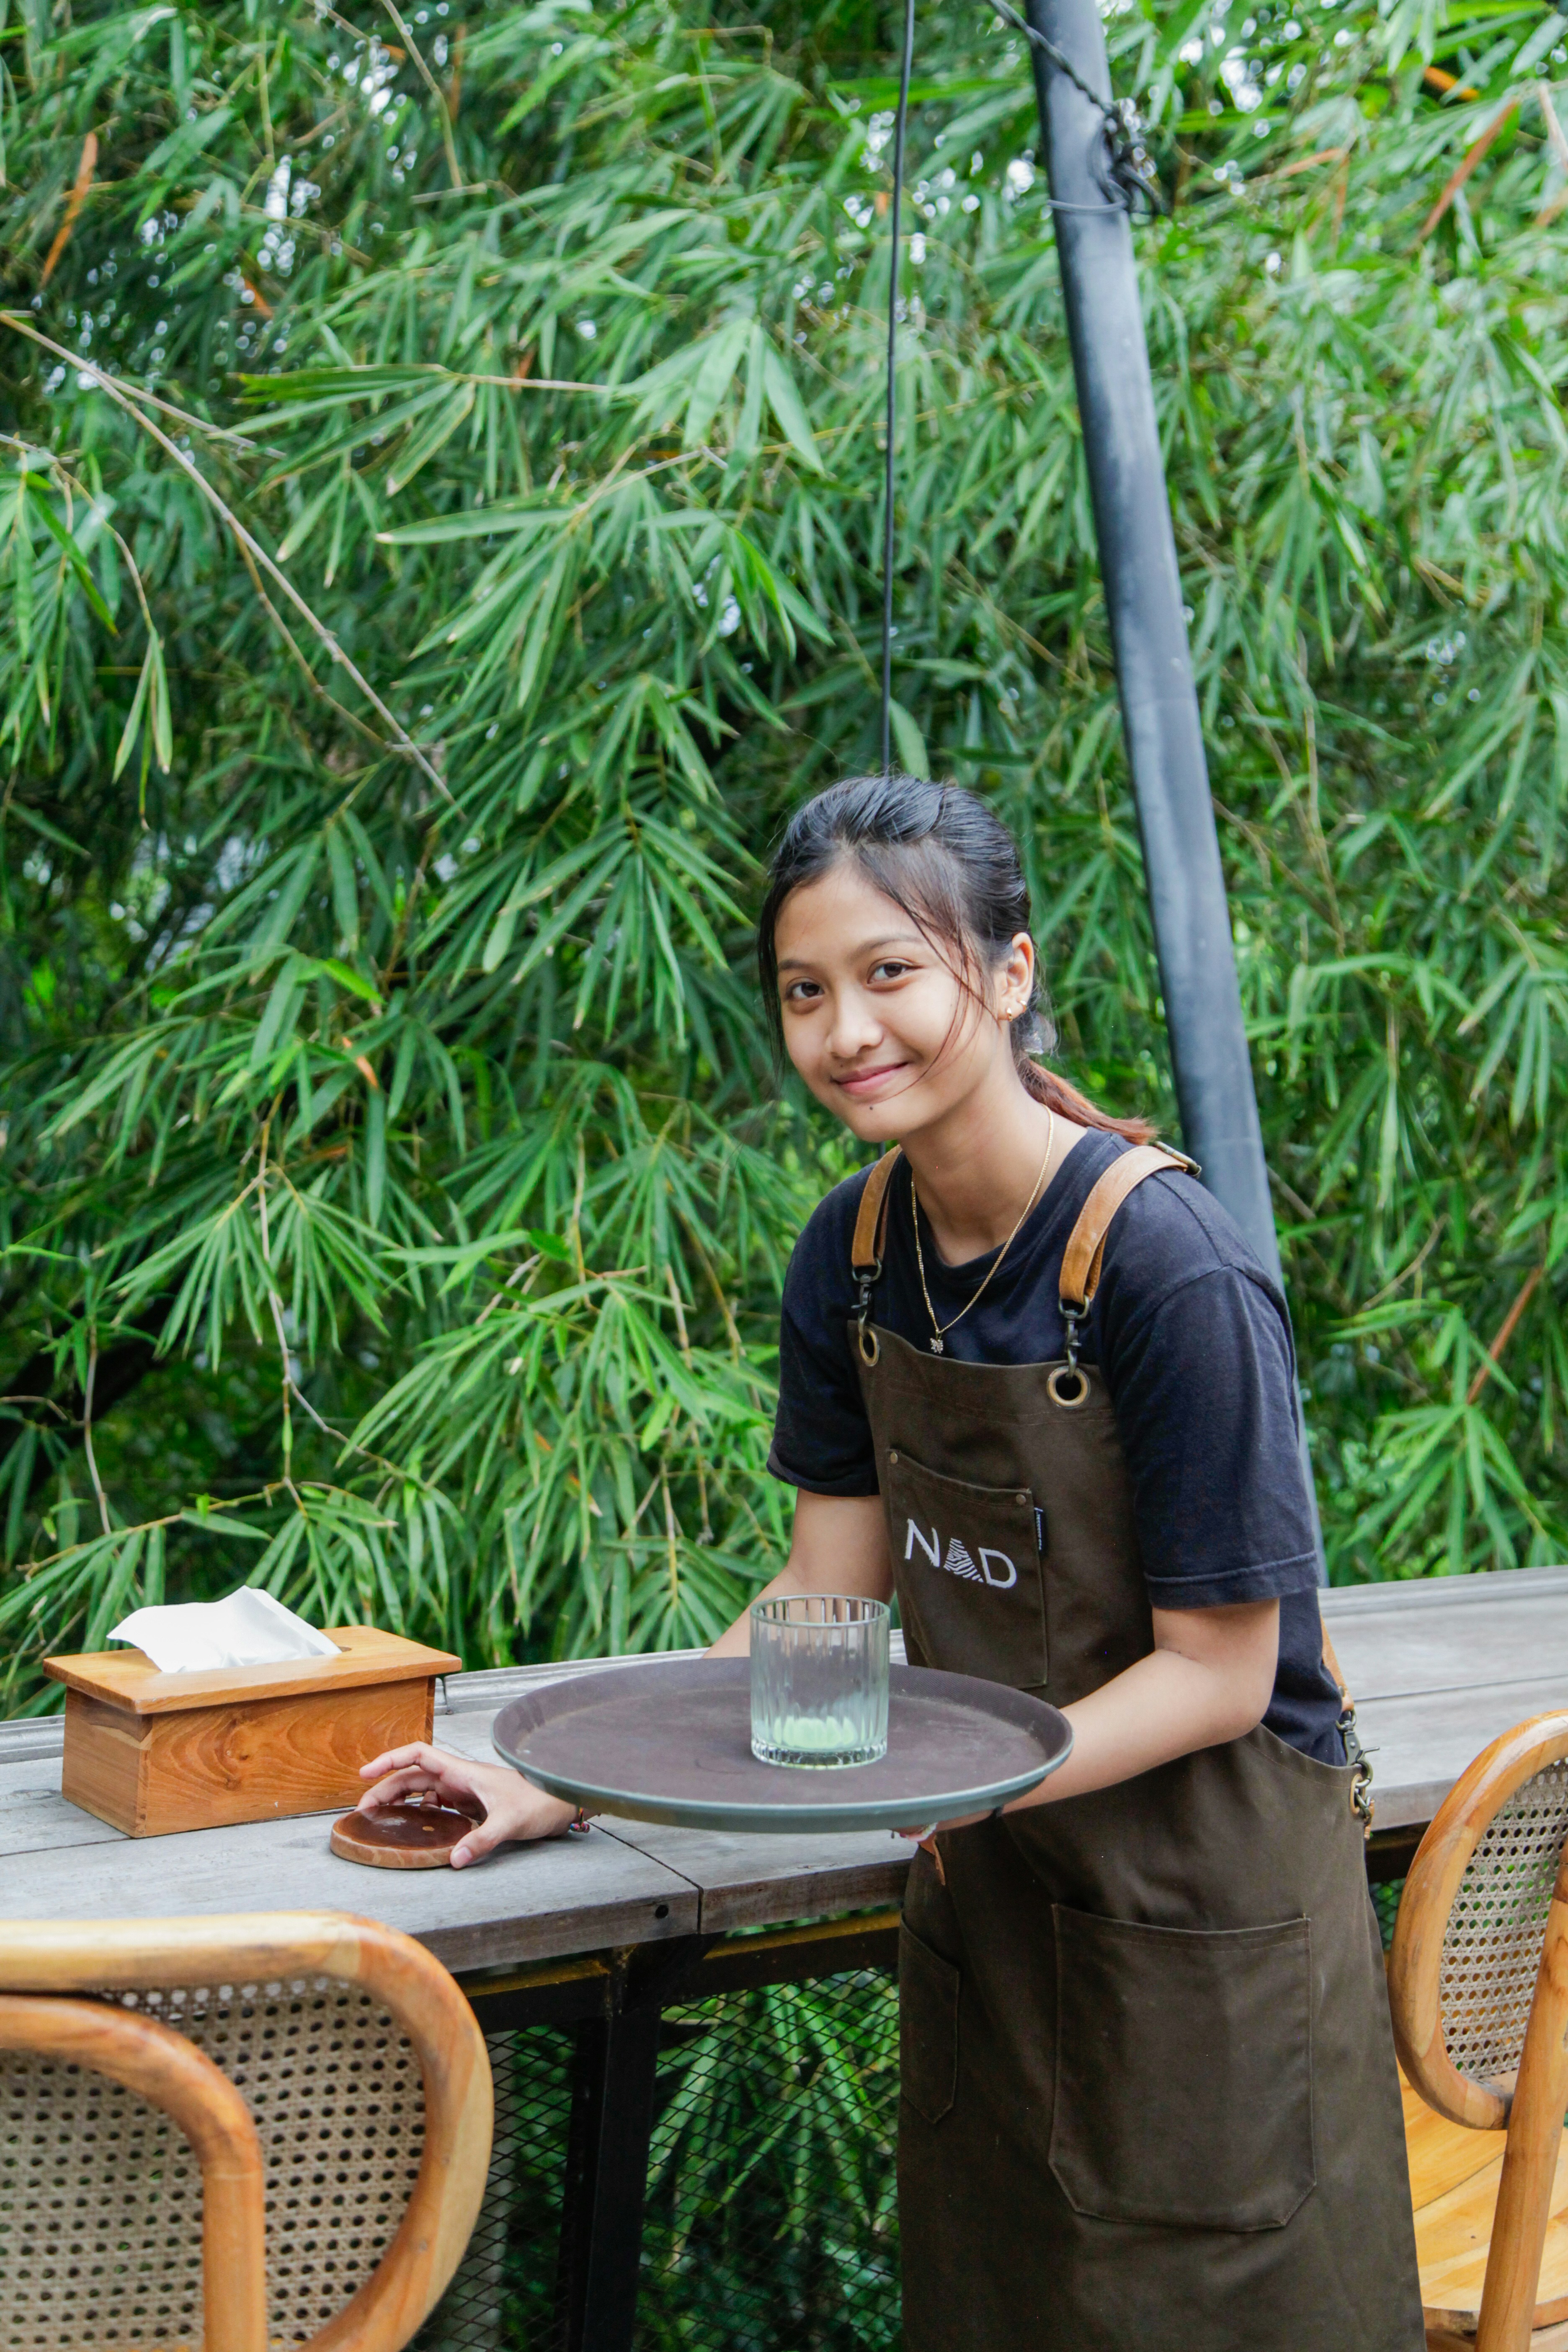
Sara Guzman
Sara Guzman
Waiter and art student
23 years old.
High school degree
Bogotá - Colombia
🎯 Goal
🎯 Goal
Pay her career by herself and enjoy more her work.
😫 Frustrations:
😫 Frustrations:
His job is stressful because she has to keep track of many things at the same time.
Let's go deep on the problem and how we solve these for our users
🥱 Difficult activation process
Andrés paid for the first month but he didn't use Treinta because he didn't have time to create their menu, so he lost money. Driving his engagement boosts retention.
Menu
Users only need to create their dishes to start selling on Treinta, but the process was too time-consuming. Now, we’ve simplified it and added bulk uploads via Excel.
😐 Low management efficiency:
Andrés relied on intuition and Excel to make monthly decisions about his menu, marketing, staff productivity, and other factors crucial for his restaurant’s profitability. Treinta lacked a tool to support him so we create an statistics feature.
Statistics
Users can track their top sales days, best-selling products, expenses by category, and employee efficiency—all accessible right from their phone.
Andrés was losing money due to poor tracking of his inventory, spoiled products, and unknown dish costs.
An easier way to record inventory
Previously, users had to calculate the cost per unit of their products manually, which took a lot of time. Now, they just input the quantity and total cost of their last order, and we calculate it for them.
Recipes
When users create a recipe, they input quantities like 100 grams per dish. Since we already know the cost per kilo from their inventory, we calculate the cost of those 100 grams, giving them the exact raw material cost for the dish.
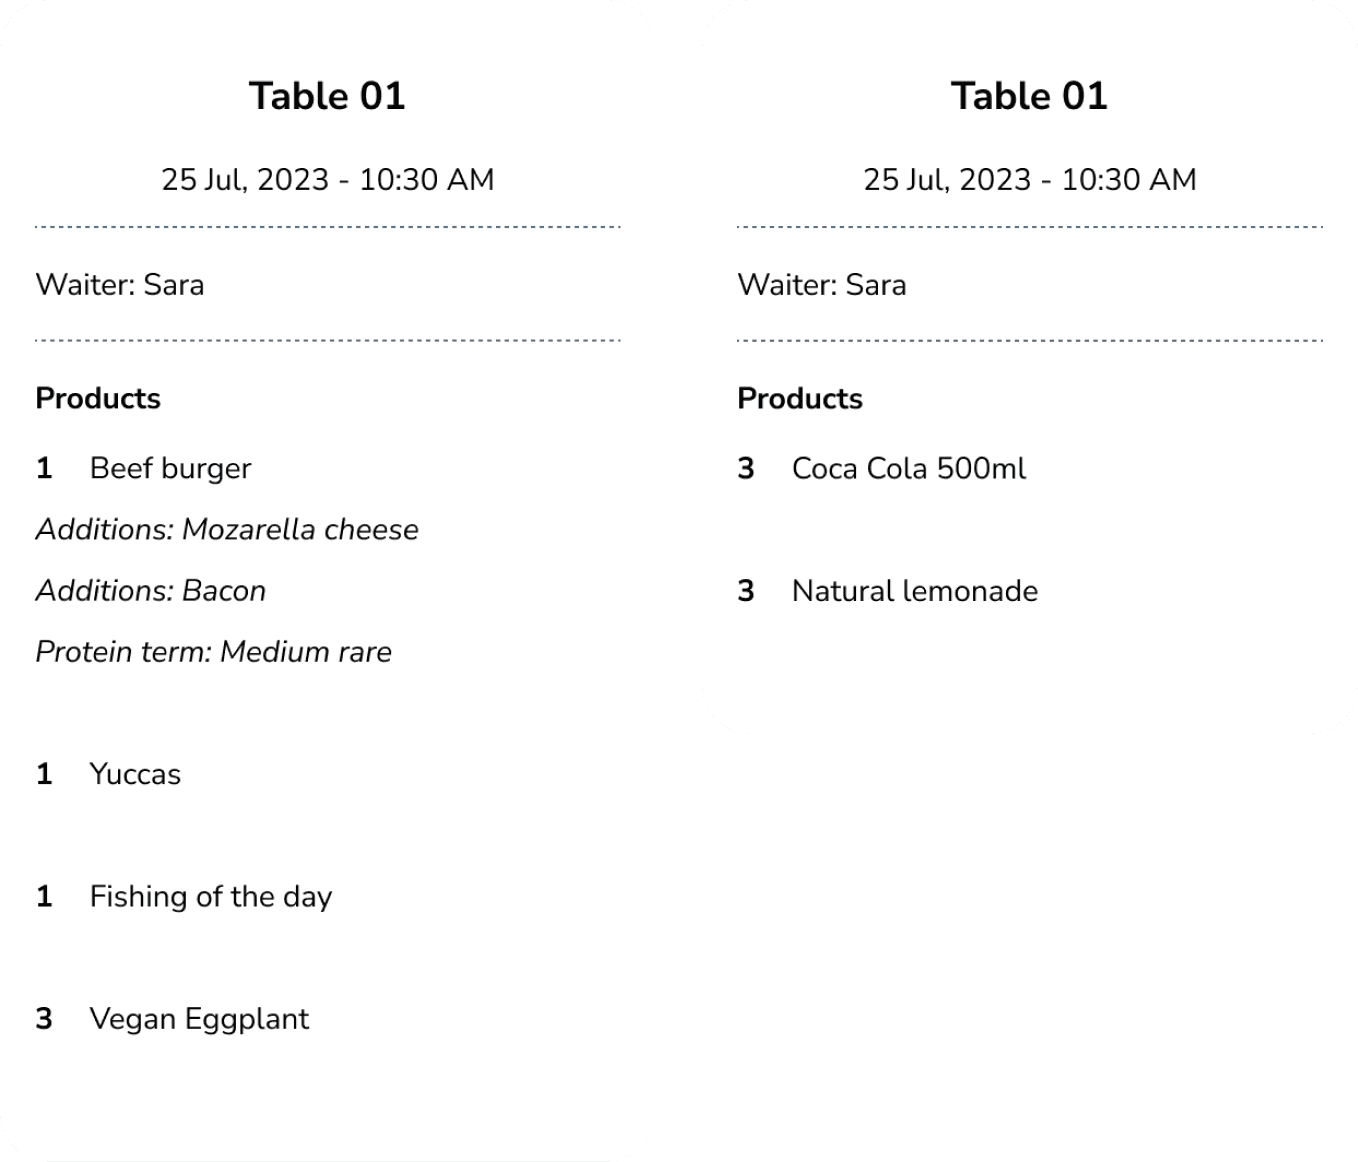
😫 Complex order creation
Sara attends to guess by taking orders, special requests, and various payment methods daily. She needs a tool to streamline operations and minimize errors, as any mistake affects her salary.
Modifiers
When dining out, it's common to request changes to a dish. We've created a feature that lets waiters easily remove ingredients or add custom modifications.
Split payments
Large tables often split payments, or a customer might pay partly in cash and partly with another method. Without this feature, users faced account imbalances. Now, they can easily add multiple payment methods to a single order.
It is common for large tables to split payments or even for the same customer to pay part of it in cash and the rest with another payment method. By not having this feature, our users had imbalances in their accounts. Now our users can add different payment methods to the same order.
😳 Software isn't enough
As we expanded to larger restaurants, we noticed they often handle both bar and kitchen orders. Having just one printer for all orders was inefficient, so we introduced multi-printer support.
Orders by zones
Users can now assign printers to specific product types, ensuring each sale is printed on the corresponding printer for seamless operations.
Measuring impact
Measuring impact
Measuring impact
Retention increased 35% on paid users
Retention increased 35% on paid users
Activation increased on 43%
Activation increased on 43%
Paid users increased 4x
Paid users increased 4x
The median number of Transactions created grew by 33%
The median number of Transactions created grew by 33%
The median number of Transactions created grew by 33%
The median number of food dishes created grew by 80%
The median number of food dishes created grew by 80%
The median number of food dishes created grew by 80%
The number of users with more than 20 ingredients grew by 71%.
The number of users with more than 20 ingredients grew by 71%.
The number of users with more than 20 ingredients grew by 71%.
Special credits to everyone who made this experience possible! Designed with 💛 for our users in Latam.
Special credits to everyone who made this experience possible! Designed with 💛 for our users in Latam.
Special credits to everyone who made this experience possible! Designed with 💛 for our users in Latam.